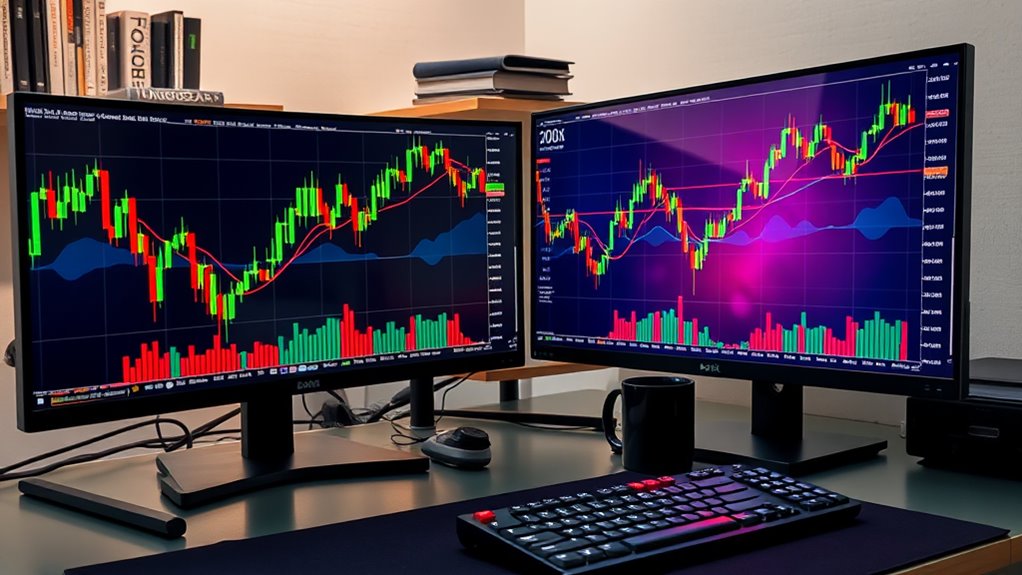
Using Moving Averages in Crypto Trading: Mastering Trends and Signals for Profit
In crypto trading, leveraging moving averages (MAs) like the Simple Moving Average (SMA), Exponential Moving Average (EMA), and Weighted Moving Average (WMA) aids traders in distinguishing market trends and making prudent decisions. These tools help identify potential support or resistance levels and forecast market movements. By deploying crossover strategies and integrating indicators such as RSI and MACD, traders can refine their market analyses, enhancing their trading strategy for better profit prospects. Continued exploration of these methods could further optimize your trading techniques.
Key Takeaways
- Use both short-term and long-term moving averages to identify market trends and potential reversal points.
- Implement crossover techniques such as the "golden cross" for bullish signals and the "death cross" for bearish trends.
- Combine moving averages with other indicators like RSI and MACD to confirm trends and enhance signal accuracy.
- Adjust moving average types (SMA, EMA, WMA) based on trading strategy preferences and market volatility.
- Always incorporate risk management strategies and consider trading volume to validate moving average signals.
Understanding the Basics of Moving Averages

Moving averages are tools used to analyze and interpret data points by averaging them over a specified period. They serve as statistical calculations that help smooth out price data, effectively reducing the impact of short-term fluctuations and noise.
This is accomplished by summing up a series of data points from a defined interval and then dividing by the total number of points in that interval.
The primary purpose of using moving averages in financial analysis, particularly in cryptocurrency trading, is to identify overriding trends and determine potential zones of support and resistance.
Differentiating Between SMA, EMA, and WMA

Traders often face a choice between different types of moving averages when analyzing cryptocurrency market trends: the Simple Moving Average (SMA), the Exponential Moving Average (EMA), and the Weighted Moving Average (WMA).
The SMA calculates an average of price data and is best suited for identifying long-term trends due to its equal weighting across all data points. In contrast, the EMA focuses more on recent prices, using an exponential decay to give more relevance to newer data, making it quicker in signaling changes in market conditions.
The WMA, similarly sensitive, uses a linear weighting approach, assigning more weight to the latest price points, hence providing a dynamic tool for short-term trading strategies.
These distinctions help traders select the most appropriate average for their trading style and objectives.
Strategies for Identifying Trends With Moving Averages

To effectively identify shifts in market trends, investors utilize various strategies involving long-term and short-term moving averages (MAs).
Long-term MAs, such as the 100-day and 200-day, reveal broader market directions, with prices consistently above these averages indicating an uptrend and below suggesting a downtrend. Analyzing these alongside the Relative Strength Index (RSI) helps confirm trends and minimize false signals.
Conversely, short-term MAs like the 10-day and 20-day adapt quickly to price changes, useful for spotting brief trends and providing dynamic support or resistance levels.
Combining these with indicators such as the Moving Average Convergence Divergence (MACD) can refine decision-making, particularly in volatile markets where quick responses are essential.
Understanding the differences between day trading and long-term investing strategies is crucial for applying these technical analysis tools effectively in varying market conditions.
Implementing Crossover Techniques for Optimal Trading

While moving averages are versatile tools in cryptocurrency trading, implementing crossover techniques maximizes their effectiveness by pinpointing potential trend reversals. This strategy focuses on moments when a short-term moving average crosses over a long-term moving average. A bullish signal, or "golden cross," occurs when the short-term average moves above the long-term average, suggesting an upcoming uptrend. Conversely, a "death cross" indicates a potential downtrend, visible when the short-term average drops below the long-term one. Additionally, incorporating insights from chart patterns and indicators like the RSI and moving averages can enhance interpretation of these signals. Crossovers, enhanced by high trading volume, provide crucial entry or exit points but require vigilant monitoring and proper risk management to avoid false triggers.
| Signal Type | Description |
|---|---|
| Golden Cross | Short-term MA crosses above long-term MA: Bullish |
| Death Cross | Short-term MA crosses below long-term MA: Bearish |
| Volume Analysis | High volume strengthens reliability |
| False Signals | More common in short-time frames |
Integrating Other Technical Indicators With Moving Averages

By integrating moving averages with other technical indicators, traders can enhance the accuracy and reliability of their analyses.
When moving averages are used with the MACD, traders can identify more robust trend signals. Incorporating Bollinger Bands helps pinpoint strong support and resistance levels, essential for making strategic entry and exit decisions.
The Relative Strength Index (RSI) alongside moving averages confirms if the momentum of a trend is sufficient to sustain it. To manage false signals caused by market volatility, stochastic oscillators can be employed with moving averages.
Furthermore, adding the Force Index allows for the detection of any divergences that may not be evident with moving averages alone, providing a more thorough analysis toolset.
Additionally, implementing risk management strategies(risk management strategies) such as setting stop-loss orders can significantly reduce the potential financial impact of adverse market movements when using these technical indicators.
Adjusting Moving Average Parameters for Improved Accuracy

Adjusting the parameters of moving averages can greatly enhance the accuracy of trend predictions in cryptocurrency trading. Traders can tailor moving average settings, like the period length and type, based on their trading strategy and the market conditions. Shorter or longer periods can be chosen to match the investment horizon, while the type of moving average (SMA, EMA, WMA) provides different sensitivities to price changes.
| Type | Timeframe | Common Periods |
|---|---|---|
| SMA | 1 min | 20, 50 |
| EMA | 1 day | 50, 200 |
| WMA | 1 week | 20, 50, 200 |
Combining multiple MAs can help delineate clearer trends, supporting more informed trading decisions. Remember to align these settings with personal trading goals and market analysis.
Best Practices and Common Mistakes to Avoid in MA Trading

As traders engage with the volatile world of cryptocurrency, understanding the best practices and recognizing common mistakes in moving average (MA) trading become essential for success.
Effective MA trading involves using a combination of indicators and varying timeframes to identify clear market trends and reduce noise on charts. Ideally, traders should blend short and long-term moving averages to get a thorough trend perspective.
On the other hand, common pitfalls include overrelying on MAs without contextual market analysis, ignoring the importance of multiple timeframes, and inadequate risk management which can lead to substantial losses.
Additionally, trading merely on moving average crossovers in volatile or sideways markets often results in poor outcomes due to frequent whipsaws and false signals.
It is also critical to integrate technical analysis tools, as discussed extensively in day trading strategies, to enhance the effectiveness of MA strategies in tracking and responding to market dynamics.
Frequently Asked Questions
How Do Taxes Impact Crypto Trading Profits Using Moving Averages?
Tax implications greatly influence the profitability of crypto trading using moving averages. Short-term trades endure higher tax rates, while long-term trades benefit from lower rates, affecting strategy and net profit realization.
Can Moving Averages Predict Sudden Market Crashes?
Moving averages, like during the hypothetical April 2020 flash crash, smooth historical data and consequently cannot reliably predict sudden market downturns as they typically lag behind real-time events. They confirm rather than forecast trends.
What Role Do Moving Averages Play in Automated Trading Bots?
Moving averages in automated trading bots help smooth price data, enabling trend identification, generating trading signals through crossovers, and assisting in risk management by setting dynamic stop-loss orders based on historical price movements.
How Does High-Frequency Trading Affect the Effectiveness of Moving Averages?
High-frequency trading affects the effectiveness of moving averages by increasing market volatility and noise, which can lead to lagging signals and false positives, reducing their reliability as standalone indicators in dynamic trading environments.
What Are Legal Considerations When Using Moving Averages in Crypto Trading Internationally?
Steering through the nuanced waters of international law requires awareness of diverse regulations, licensing mandates, anti-money laundering stipulations, and applicable tax considerations when employing technical strategies like moving averages in global cryptocurrency markets.
Conclusion
In the voyage of crypto trading, mastering moving averages—akin to Odysseus mastering the seas—provides a map through turbulent market waves. By differentiating between SMA, EMA, and WMA, and integrating other technical tools, traders can navigate with more certainty. Adjustments and best practices further refine this navigational aid, reducing the peril of common mistakes. Consequently, armed with knowledge and savvy application, traders chart a course toward potentially profitable horizons.


